Making Sense of Cross Platform Marketing Attribution
Deductive, now part of MarketCast, has spent much of the last few years developing new attribution models that allow sellers within the TV industry to accurately attribute conversions to the ad campaigns published on their platforms. One of the best ways we’ve found to do this is through the application of game theory. Game theory’s mathematical models evolved in the 1950s to map strategic interactions among rational thinkers. In game theory terms, marketing attribution is an example of a “Fair Cake-Cutting” problem. In these problems, a cake needs to be divided equitably between a group of people with different claims on the cake.
Consider an ad campaign that appears on 30 different TV channels. The buyer knows from an increase in sales and revenue that the campaign made a million conversions. From the perspective of the individual networks, however, one network claims 100,000 people who have watched the ad during its programming have subsequently converted, another claims credit for 300,000 conversions, and a third for 50,000 conversions. When we add up the total conversions from the 30 networks, we typically get much higher than a million because more than one network is taking responsibility for each conversion.
Thus, the problem is how to apportion the credit and the income for conversions equitably between the different competing TV networks. This is a classic fair cake-cutting problem. It occurs because most viewers saw the same ad multiple times across networks.
So, who’s performed best?
In the digital marketing world, there are typically four different approaches that are commonly applied. Each of these approaches works on each conversion and splits the value between the various media that exposed the consumer.
In first touch attribution, the first media measured gets 100% of the credit. In last touch, it all goes to the last media. With evenly weighted attribution, the credit is attributed equally among each exposure. Another option is starter-player-closure attribution, where both the first and last media exposed get extra credit, and everyone else gets some but less credit. There are further variants such as time-decay attribution that reduce the contribution exponentially from the first exposure to the conversion.
Online properties like Google and Facebook prefer last-touch attribution, as this means credit for the conversion should go to the last media before the conversion. This approach gives the search ad 100% of the credit for the conversion because search is the last place people see an ad before they make a purchase.
In all these approaches, the digital platform claims it made the conversion even though the actual inspiration for the conversion was, in many cases, the TV ad campaign. This claim is incorrect because it fails to divide the cake fairly, giving undue credit and revenue to the digital platform at the networks’ expense. The last-touch attribution model is far more problematic for TV-based ad campaigns than for digital ones. In 80% of the digital cases, there is only one touchpoint before conversion.

Enter the Shapley value
We began exploring the other options for attribution after one of our prominent clients expressed dissatisfaction at the attribution models available and were attributing networks in isolation. Given that TV viewers watch many networks that offer ad supported content, we felt that game theory must offer a fair distribution of ad campaign credit for conversions.
There is a mathematically correct way to solve this attribution cake-cutting problem, discovered by mathematician and economist Lloyd Shapley in 1953. Known as “The Shapley value,” it is a solution concept in cooperative game theory, developed when Shapley was working on the problem of apportioning credit in cooperative games to distribute the payout equitably. In our ad campaign case, the number of conversions assigned to any particular TV network needs allocating. Given that some networks contribute more to a successful campaign outcome than others, it is essential to accurately solve this problem.
The Shapley value is a form of aggregate analytics that considers the combination of views across networks resulting in conversions. We first work out every single combination of networks that people can be exposed to, and then we calculate the incremental value of each network or channel in every possible combination. If there are 30 channels/networks/apps, this means over a billion calculations. While this would have been insurmountable when Shapley developed the measure, such arithmetic is within our reach with modern computing. Indeed, while until fairly recently it was only possible to calculate the Shapley value for 5 to 10 TV networks, Deductive, now part of MarketCast, is successfully able to calculate the Shapley value and ensure a fair distribution of the cake for an ad campaign running on over a hundred networks.
How does it work?
To illustrate how we calculate the Shapley value, consider an ad campaign by a direct-to-consumer brand that runs on a Digital news site, Linear TV network and Cable VOD service (addressable) to promote a new mobile app. They have 72k downloads of the app and want to know how many downloads can be associated with each media.
The reports received from the advertising providers are as follows:

As expected, between them, the platforms are claiming more conversions than was experienced by the client. The total conversions claimed from each platform sums up to 145k rather than the 72k downloads they know they had. The duplication gives us an artificially reduced cost per download because many conversions saw the ad across multiple platforms.
How many conversions should we assign to each platform?
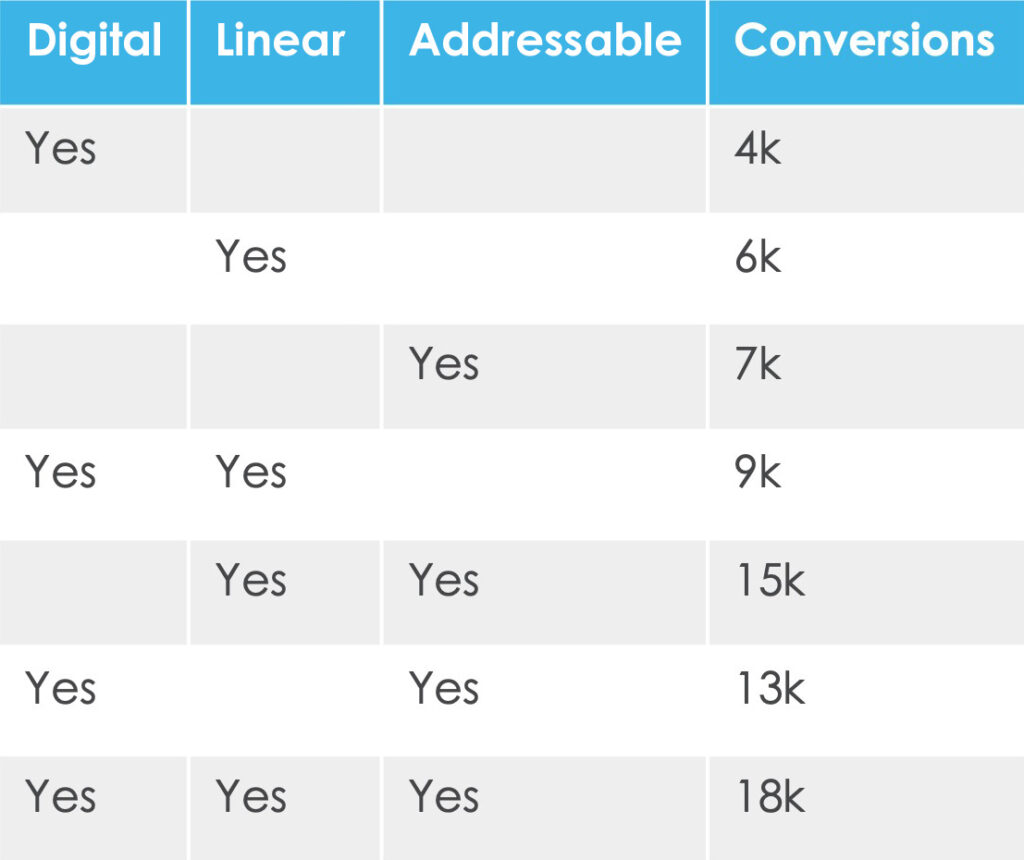
We can fuse the impressions and conversions data, so we can see how many devices were exposed and converted on each different combination of media.
The table on the right shows how many conversions occurred after a device was exposed on each of the different media – Digital, Linear and Addressable.

To assign the value between each of the platforms, we calculate the Shapley value. The Shapley Value is the mathematical property that splits the total amount between the players in a game.

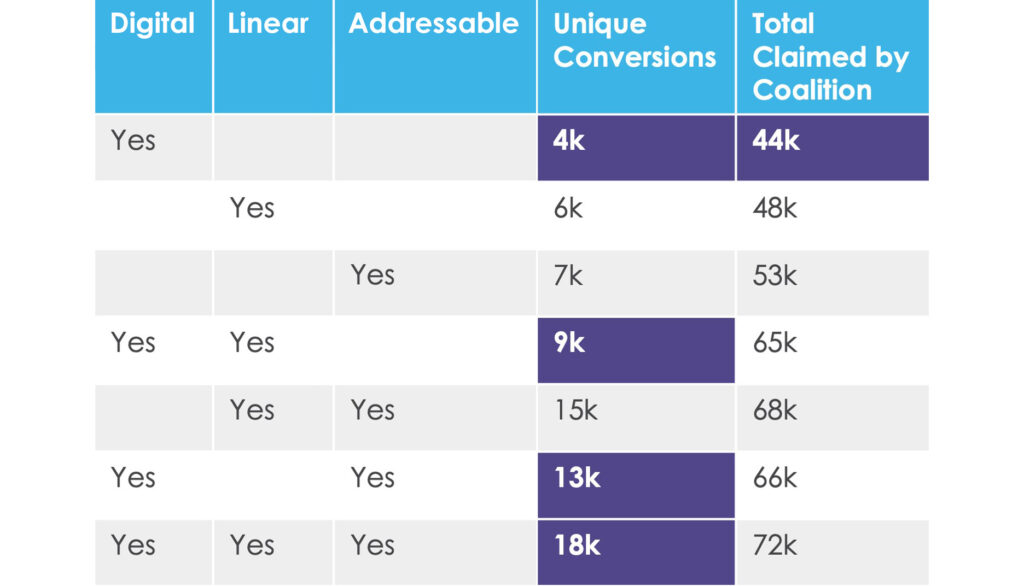
We calculate the Shapley value by creating coalitions containing the different media for each combination of media. Each coalition claims the total amount from each combination involving a player in the coalition.
In our example, the Digital news publisher claims a total value of 44k conversions because that’s the value of all of the combinations that include Digital (4k+9k+13k+18k).
We can calculate the total value claimed by each coalition as follows:

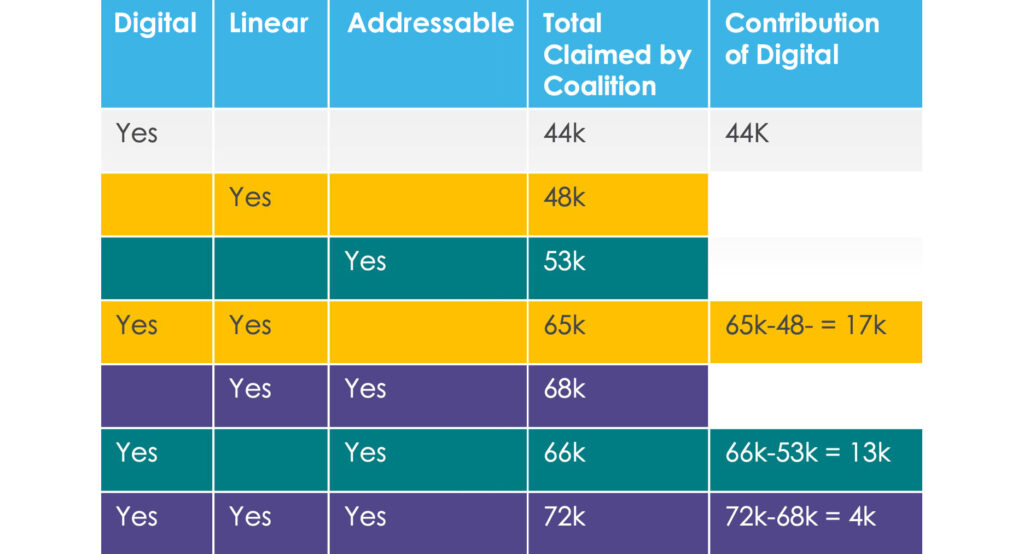
We then compare each coalition’s value against every other coalition’s value to get each player’s incremental contribution in the coalition. In this example, the contribution of Digital to the Digital /Linear coalition is 11k because the total claimed by that coalition, 59k, is 11k more than the sum claimed by the Linear coalition (48k):

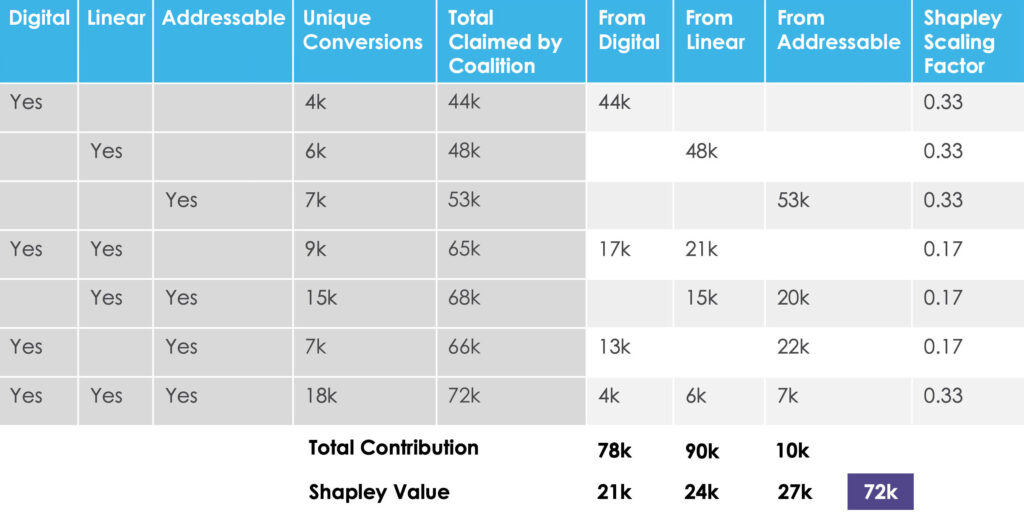
We calculate this for all coalitions and multiply by the Shapley scaling factor to get the Shapley value.
The scaling factor ensures that the Shapley value always adds up to the total amount of each combination’s unique conversions. In our example, the Shapely value has split the actual number of downloads, 72k, between each of the media in proportion to their value.

How to optimize our campaign?
When we apply the contributed conversions back to the original Shapley values, we see that the Addressable Cable VOD option is outperforming both the Digital news publisher and the Linear TV network in the multi-touch model.

If the client relied upon single touch attribution, they would have significantly under-estimated the cost of subscriber acquisition. Furthermore, according to our data, the Addressable Cable VOD spend was 80% more cost effective than either Digital publisher or Linear TV network for driving conversions for this particular campaign. By contrast, the single touch model reported a difference of only 10-20%.
We can use this information to optimize our campaign by increasing our spending on the most cost-effective media and reducing spend on less effective media. Learn more about MarketCast Attribution services.


